
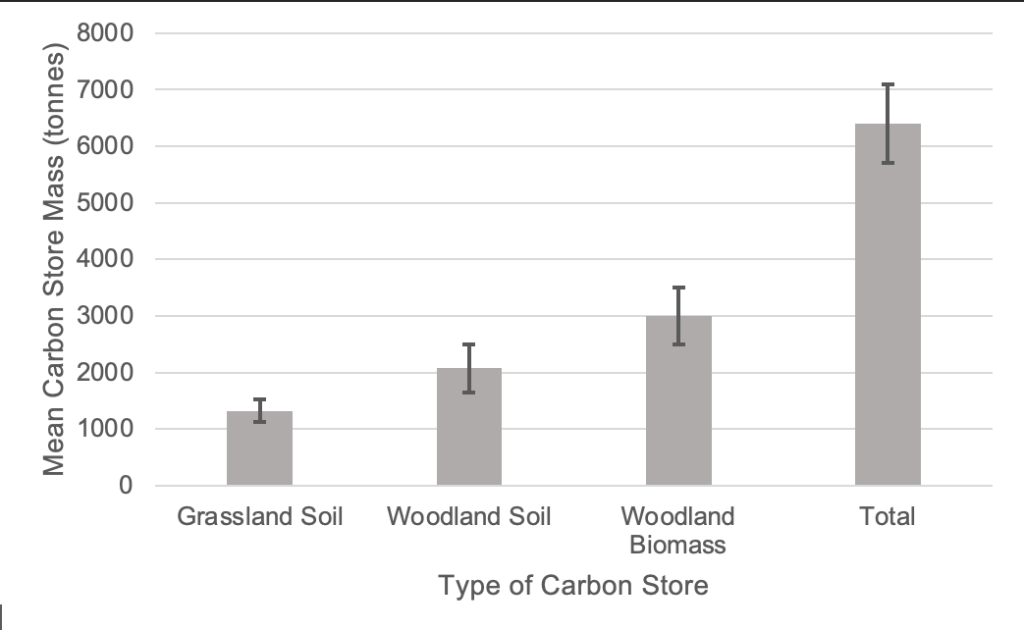
Three main components make up the majority of the Lancaster University carbon stock as shown in Figure 1. The rural area of campus can be split into two separate biomes, woodland and grassland, which hold the majority of terrestrial carbon on campus. The woodland consists of two main carbon stores: soil and biomass. Collectively, these stocks hold 79.38% (5073.91 ± 934.24 tonnes) of the terrestrial carbon on campus, with the remaining 20.62% (1325.21 ± 200.50) being stored in grassland soil. The woodland approximately has a 0.015 tonnes/m2 carbon stock potential compared to about 0.0049 tonnes/m2 for the grassland. This means it has better storage potential for terrestrial carbon. Several key assumptions were made when obtaining these values for each carbon store. It was assumed in the crown biomass equation that ‘any tree of fewer than seven centimetres diameter at breast height contains no merchantable stem volume’ so does not hold enough carbon to be considered in the calculations [1]. In reality, the sum of carbon held in all these trees across campus will be a significantly large number. It was also assumed that the urban part of campus would not be considered in these estimates as they do not hold enough carbon for long enough periods. However, infrastructure like the LICA building contain large amounts of wood so have a large carbon stock [2] and should be considered in future studies. It was also assumed that all the soil is the same depth, and each tree is the same height. More measurements would be required in order to obtain a greater accuracy in the carbon store figures. A large cause of uncertainty are the area calculations. As a concrete area of campus was not given, it resulted in a large uncertainty and spread in these numbers. This is then reflected in the large standard errors seen in Figure 1. The areas are used to multiply the data to equate for the whole of campus. This also applies for the woodland and grassland areas and the subjectivity can lead to less accurate results.
References
1. Randle, T., Matthews, R. and Jenkins, T. (2014). Technical Specification for the Biomass Equations Developed for the 2011 Forecast.
2. https://www.sciencedirect.com/science/article/pii/S2666165920300260


Leave a comment